MochaHtmlReporter
About
This reporter delegate generates an interactive HTML report and displays it in a window. It is the default reporter for js.component.
Usage
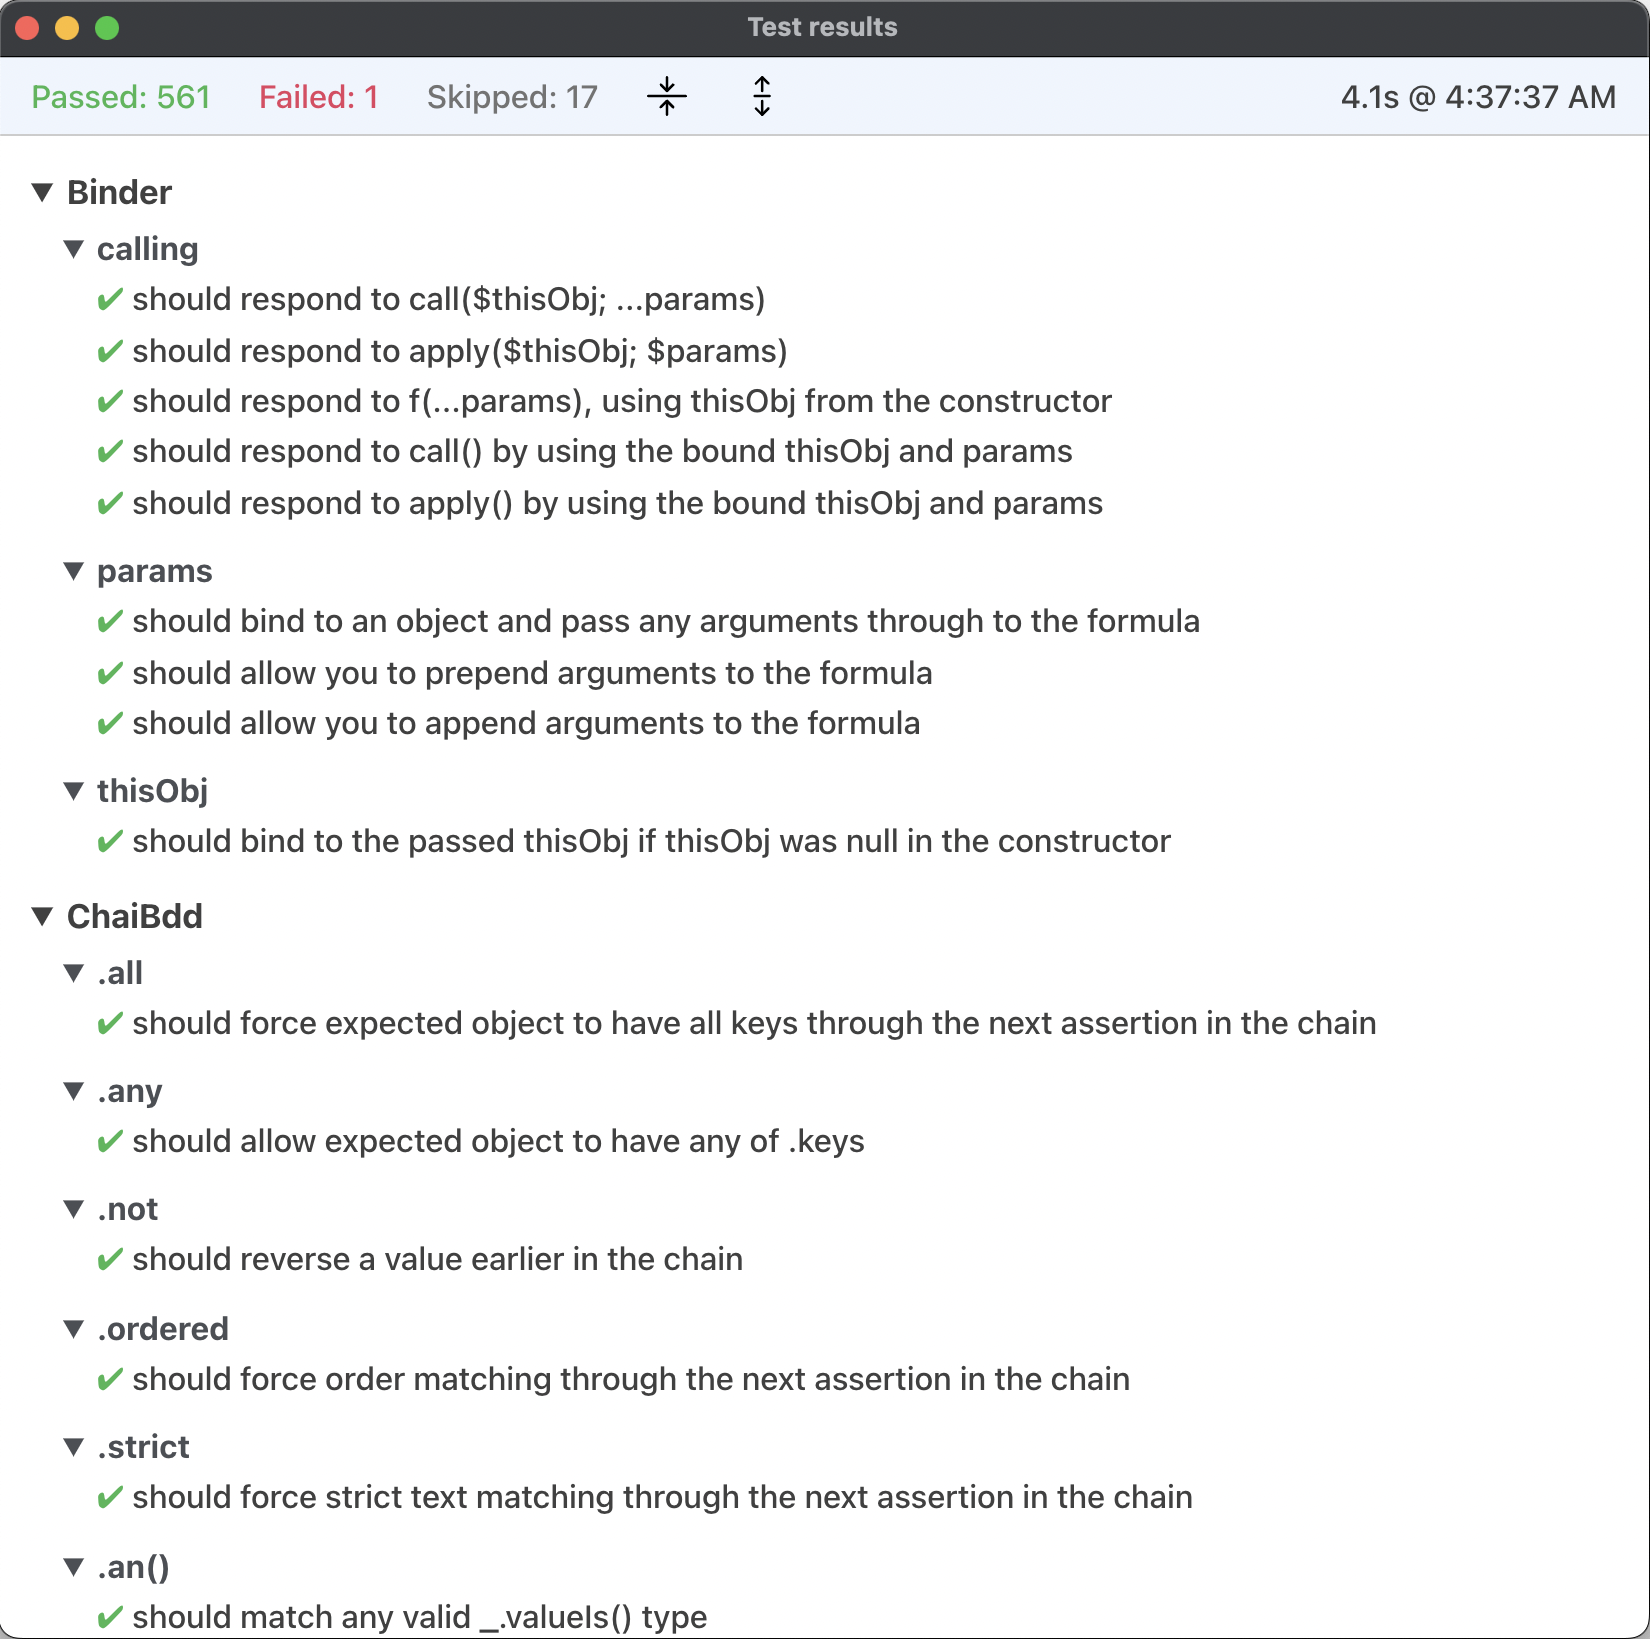
When the report is finished building, a new window appears that will look something like this:
The window is resizable and can be moved around, and the next time you run this reporter the window will be in the same position with the same size. The window can be closed via Cmd-W (macOS) or Ctrl-W (Windows).
NOTE
Each time you run this reporter, a new report is generated in a new window. The previous report window is not closed.
Report content
The content of the report consists of a fixed header and a scrollable body which contains the hierarchy of test suites (in bold) and their assertions. Each suite can be expanded or collapsed individually by clicking on the triangle to the left of the suite name. Since this is a standard web view, all of the standard navigation keys work, such as Space bar/Page down, Page up, Home and End.
The header displays, from left to right:

The count of tests that passed.
The count of tests that failed.
The count of tests that were skipped.
The
Collapse allicon. Clicking this icon (or pressingc) collapses all of the test suites.The
Expand allicon. Clicking this icon (or pressinge) expands all of the test suites.The time it took to make the test run.
The local time at which the report was generated. The report time format is localized to your current locale using the "LTS"
DateTimeformat.
NOTE
If you have selected a subset of tests to run using the MochaRunner options, the counts will reflect only those tests.
Test display
Each test displays the description passed to .should() or .specify(). Hovering over the description displays the class, function name and line number within the body of that function at which the test occurred.
TIP
In interpreted mode, clicking on the description opens the source file in the method editor with the cursor placed at that test. 🔥 This is especially handy when you have a large test suite and want to quickly find a test that failed.
Tests that passed are marked with ✔︎.
Assertions that failed are in red and marked with ✖︎︎. Detailed info about the error is displayed below the assertion. Since failed assertions may be out of view and scattered over a large number of suites, you can quickly view only failed assertions by clicking on Failed: # in the header, or by pressing f. This will hide all of the test suites that passed and display only the test suites that failed:
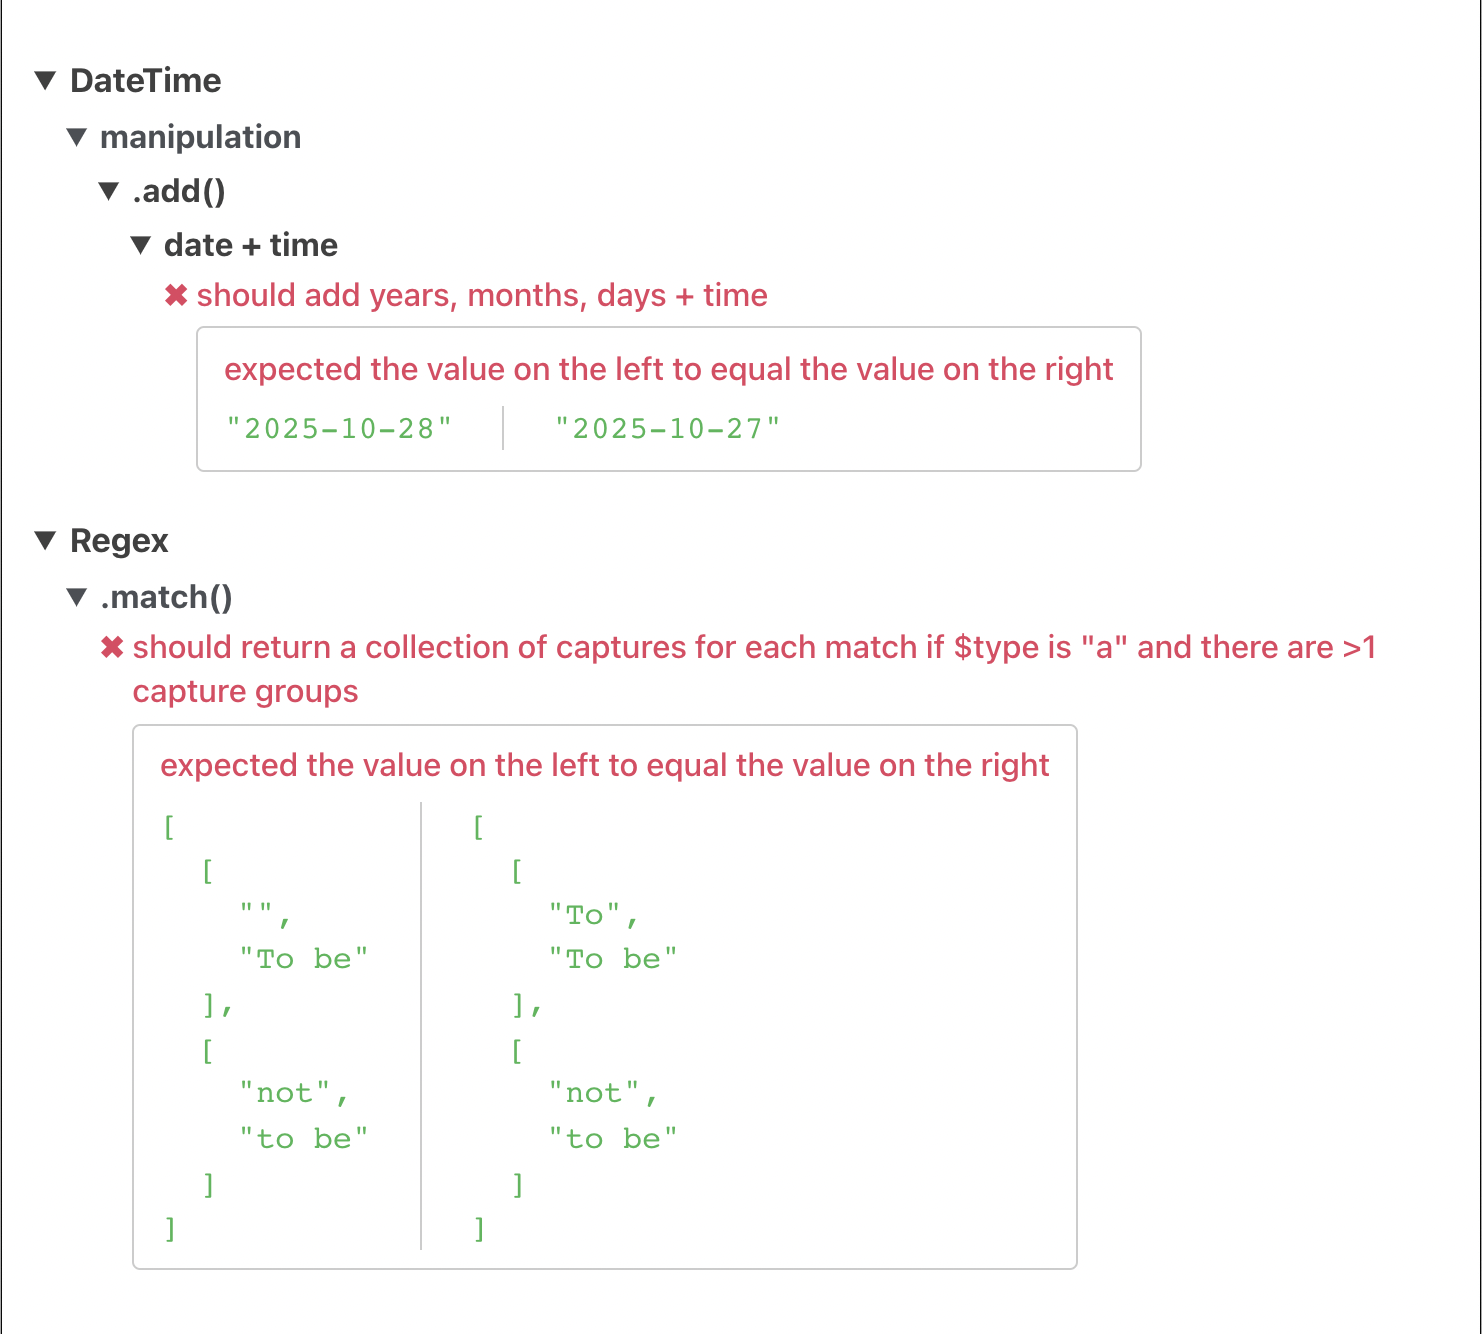
The green value on the left is the value that was passed to .expect(), and the green value on the right is the value that was passed to the assertion that failed. The red message above the values explains in detail why the assertion failed.
If the failure-only view is already active, clicking on Failed: # or pressing f will restore the full display.